Blog Flux LinkLog: Outgoing Link Logging and Tracking for DAYTRADING FDAX FUTURE DAYTRADING FDAX FUTURE DOW JONES BLOG

Friday, May 26, 2006

THE MARKET NOW

I was thinking the last couple of days about the market and the doom scenario's some described, comparing this market with the fall of the late nineties after 1997, talking about inflation risks and FED's chairman Greenspan commenting about the market and inflation.
Off course the usual conspiracy theories always pop up.


Niederhoffer posting about the common errors made by forecasters, quite amusing to read.


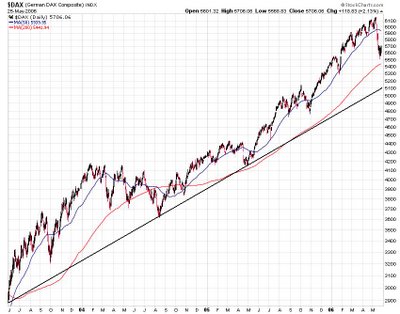
Markets started two weeks ago to go down rapidly, an end of a trend , off course I meant the trend of this year which started in November of last year; though the DAX still is in a big uptrend since 2003, see a classical uptrend in the chart below (click to enlarge).


Markets bounced up thursday, there were some clues though given by some. So Stephan Vita who posts this graph of the NYMO McClelan indicator, an indicator more often used by index followers, and asking the retorical question : "Why Does a Bounce Come?" ; it speaks for itself.
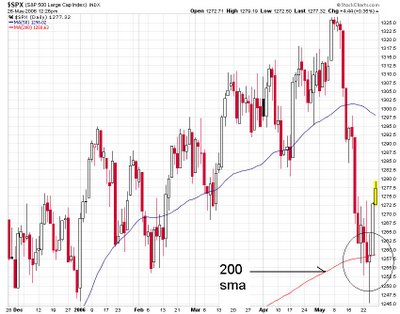
The S&P 500 bouncing off the 200 SMA very neatly: safed by the bell a least for the moment.


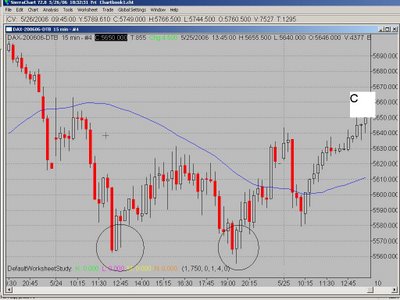
I am allways very cautious about predictions because who can predict the future? But to be honest I saw wednesday the FDAX nice bottoming out, with a double bottom and a positive divergence in price at C assuring at least a short term recovery.


Also read again Niederhoffer when he is Briefly Speaking about the markets and about romance too :)


Wednesday, May 24, 2006

EXPECTANCY AND WINRATIO (3)

One of the results of my last posting on expectancy is the size of average win compared to the average loss:

"With these examples we see that increasing the average win is more favourable for the expectancy and therefore the profability than decreasing the average loss, but also that increasing the win ratio proportional increasing the expectancy."

There is a restriction to these statements: this is only true for a winratio p < 1/2. I stated it here due to my own bias towards trading in the sense that I never look at tradingsystems with a winratio smaller than 1/2.


Although completely possible for someone to trade, it is not my cup of tea. You may find and trade a sytem which produces 3 winners out of ten, the winners to be bigger than the losers. See the graph for the expectancy in this case in my posting before. I personally discard these systems because of the following reasons.

  • The problem of outliers.

  • Psychology involved

  • Consistency

  • Formal reasons


I. The outlier problem.
One of the problems of data sampling and data processing is the uneven influence outliers have on the results. A big trade outcome may be not representative but just a coincidence. You have to watch for this trap. How many data do you need to obtain reliable results? Though allways important for valuating a trade system, for a system with the need of bigger winns (a trend following system) this becomes very urgent. You may be waiting for another winner which may never show up.


There is another practical problem: you may not miss the bigger trades , this is allways possible for many reasons, your final outcome of your system being very sensitive to pick these winners.


II. The psychology involved
It can be very hard to trade a system in which many losers occur in a row. You have to be very patient and disclipined to trade a system like that. Your account has to be big enough to take this easily, the risk of a gambler's ruin is allways at stake here.


III. Consistency
Time consistenccy is an important facor in my trading and may be treated on a next occasion. For the moment it is enough to note that consistency in trade systems with lower win ratio's only may be expected in longer lasting time frames, a result badly bearable for me.


IV.Formal reasons
There exists a rigorous and formal model for a maximum betting size based on the work of Dubins and Savage (1976) in their book with the inspiring title How to Gamble if you Must. One of their results was that in an unfair game, eg. a game where your win chances are less than 1/2 (a play in which the odds are against you) your maximum chances are only achieved when staking the maximum. This is called 'bold play' in these models.


Later work confirms these results, see eg. an overview of Schweinsburg : Improving on bold play when the gambler is restricted. For a superfair game, eg when p>1/2, it has been shown that a more realistic timid strategy of staking being optimal.


Now these models cannot directly transformed to trading systems because they are restricted to so called red and black models in which outcomes are either black or red (plus 1 or minus 1 and so on, the casino games) but may give some clues to sub-optimal strategies when using winratios > 1/2.


Related:


Monday, May 22, 2006

EXPECTANCY AND WIN RATIO (2)

My posting about expectancy made very clear the importance of this quantity for developing and valuating tradesystems. A good and clear understanding of the meaning of Expectancy is therefore necessary. But how important expectancy may be, one of my last statements is that, at least for me, the winratio is of very great use. I want to place some additions and comments on expectancy here.


We know that:


  • E = P(w)W - P(l)L (1)

  • where:

  • E = expectancy

  • P(w)= probability of a loss

  • P(l)= probability of a win

  • W = average win

  • L = average loss.


Van Thorp uses in his analyses the expectancy per dollar risk, the expected return of a trade per dollar invested. He therefore divides E by the average loss L. Three examples may clear up the influences of the varying parameters involved.


I. Suppose an average win of 200 euro, an average loss of 100 euro, a win ratio of 0.75.
E becomes 0.75*200- 0.25*100 = 125 euro. Per euro risk is this 125/00 = 1.25

II. Now suppose the average loss two times as big, eg. 200 euro.
E = 0.75*200 - 0.25* 200 = 100, per euro risk of 1 euro.

III. Now we halve in our first example the average win to 100 euro.
E = 0.75*100 - 0.25* 100 = 50 euro, per euro risk 0.5 euro.

IV. Let p be increased with a factor of 15% eg p= 0.8625 in our first example.
E = 0.8625*200 - 0.1375*100 = 158.75 euro which is almost a double of increase for E.

With these examples we see that increasing the average win is more favourable for the expectancy and therefore the profability than decreasing the average loss, but also that increasing the win ratio proportional increasing the expectancy.


We can write Expectancy per euro risk as:


  • E = pW -qL, off course p+q = 1

  • E/L = (pW- qL)/L

  • E/L = (p/L)*W -q/L*L

  • E/L = pR - q (2)

  • in which R= W/L the profit factor.


(2) Describes the expectancy per euro risk as a lineair function of R, so a line with slope p. When putting E = 0 (2) becomes:
0= pR - q , so R = q/p the intersection with the horizontal R axis and -q the intersection with the vertical E axis. See the figure below


From this figure we can see that if p < q eg. p < 1/2, R the profit ratio has to be bigger than 1 and even bigger than q/p for the expectancy to become positive. When p > 1/2, R also equals q/p but because in this case the ratio q/p is less than 1, a positive expectancy can be expected sooner, eg. with a smaller profit loss ratio.


The figure also gives how big q/p has to be for a system with a positive expectancy for a given profit loss ratio R.


Another point which has to be made with relation to expectancy is that formula (1) for the expectancy is only an approximation for a real trading system. In a real live real tradingsystem we may expect many possible outcomes for a trade, positively or negatively, and each outcome with a different probability p. Let outcome X¡ with ¡= 1, 2 , 3 ..k and probability p¡.
The expectancy of this real live tradingsytem becomes more complicated and becomes:


ΣP¡X¡ /ΣP¡(X¡)^2


See for a formalism this article about Money management.


Another point to be made here is that returns, the outcomes of a system may not be normally distributed but oblique towards (hopefully!) positive returns. This may especially being the case when using a fixed stop. Such a distribution may be more precisely described as a Weibull distribution, an interesting point but beyond the scope of this posting.


I currently look at my returns with respect to a Weibull distribution. One of the nice things of this kind of representation is that a Weibull distribution has a surprisingly relatively simple calculus involved.