EXPECTANCY AND WIN RATIO (2)
My posting about expectancy made very clear the importance of this quantity for developing and valuating tradesystems. A good and clear understanding of the meaning of Expectancy is therefore necessary. But how important expectancy may be, one of my last statements is that, at least for me, the winratio is of very great use. I want to place some additions and comments on expectancy here.
We know that:
Van Thorp uses in his analyses the expectancy per dollar risk, the expected return of a trade per dollar invested. He therefore divides E by the average loss L. Three examples may clear up the influences of the varying parameters involved.
I. Suppose an average win of 200 euro, an average loss of 100 euro, a win ratio of 0.75.
E becomes 0.75*200- 0.25*100 = 125 euro. Per euro risk is this 125/00 = 1.25
II. Now suppose the average loss two times as big, eg. 200 euro.
E = 0.75*200 - 0.25* 200 = 100, per euro risk of 1 euro.
III. Now we halve in our first example the average win to 100 euro.
E = 0.75*100 - 0.25* 100 = 50 euro, per euro risk 0.5 euro.
IV. Let p be increased with a factor of 15% eg p= 0.8625 in our first example.
E = 0.8625*200 - 0.1375*100 = 158.75 euro which is almost a double of increase for E.
With these examples we see that increasing the average win is more favourable for the expectancy and therefore the profability than decreasing the average loss, but also that increasing the win ratio proportional increasing the expectancy.
We can write Expectancy per euro risk as:
(2) Describes the expectancy per euro risk as a lineair function of R, so a line with slope p. When putting E = 0 (2) becomes:
0= pR - q , so R = q/p the intersection with the horizontal R axis and -q the intersection with the vertical E axis. See the figure below
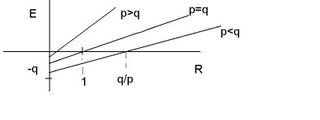
From this figure we can see that if p < q eg. p < 1/2, R the profit ratio has to be bigger than 1 and even bigger than q/p for the expectancy to become positive. When p > 1/2, R also equals q/p but because in this case the ratio q/p is less than 1, a positive expectancy can be expected sooner, eg. with a smaller profit loss ratio.
The figure also gives how big q/p has to be for a system with a positive expectancy for a given profit loss ratio R.
Another point which has to be made with relation to expectancy is that formula (1) for the expectancy is only an approximation for a real trading system. In a real live real tradingsystem we may expect many possible outcomes for a trade, positively or negatively, and each outcome with a different probability p. Let outcome X¡ with ¡= 1, 2 , 3 ..k and probability p¡.
The expectancy of this real live tradingsytem becomes more complicated and becomes:
ΣP¡X¡ /ΣP¡(X¡)^2
See for a formalism this article about Money management.
Another point to be made here is that returns, the outcomes of a system may not be normally distributed but oblique towards (hopefully!) positive returns. This may especially being the case when using a fixed stop. Such a distribution may be more precisely described as a Weibull distribution, an interesting point but beyond the scope of this posting.
I currently look at my returns with respect to a Weibull distribution. One of the nice things of this kind of representation is that a Weibull distribution has a surprisingly relatively simple calculus involved.
Systemtrading
Expectancy
We know that:
- E = P(w)W - P(l)L (1)
- where:
- E = expectancy
- P(w)= probability of a loss
- P(l)= probability of a win
- W = average win
- L = average loss.
Van Thorp uses in his analyses the expectancy per dollar risk, the expected return of a trade per dollar invested. He therefore divides E by the average loss L. Three examples may clear up the influences of the varying parameters involved.
I. Suppose an average win of 200 euro, an average loss of 100 euro, a win ratio of 0.75.
E becomes 0.75*200- 0.25*100 = 125 euro. Per euro risk is this 125/00 = 1.25
II. Now suppose the average loss two times as big, eg. 200 euro.
E = 0.75*200 - 0.25* 200 = 100, per euro risk of 1 euro.
III. Now we halve in our first example the average win to 100 euro.
E = 0.75*100 - 0.25* 100 = 50 euro, per euro risk 0.5 euro.
IV. Let p be increased with a factor of 15% eg p= 0.8625 in our first example.
E = 0.8625*200 - 0.1375*100 = 158.75 euro which is almost a double of increase for E.
With these examples we see that increasing the average win is more favourable for the expectancy and therefore the profability than decreasing the average loss, but also that increasing the win ratio proportional increasing the expectancy.
We can write Expectancy per euro risk as:
- E = pW -qL, off course p+q = 1
- E/L = (pW- qL)/L
- E/L = (p/L)*W -q/L*L
- E/L = pR - q (2)
- in which R= W/L the profit factor.
(2) Describes the expectancy per euro risk as a lineair function of R, so a line with slope p. When putting E = 0 (2) becomes:
0= pR - q , so R = q/p the intersection with the horizontal R axis and -q the intersection with the vertical E axis. See the figure below

From this figure we can see that if p < q eg. p < 1/2, R the profit ratio has to be bigger than 1 and even bigger than q/p for the expectancy to become positive. When p > 1/2, R also equals q/p but because in this case the ratio q/p is less than 1, a positive expectancy can be expected sooner, eg. with a smaller profit loss ratio.
The figure also gives how big q/p has to be for a system with a positive expectancy for a given profit loss ratio R.
Another point which has to be made with relation to expectancy is that formula (1) for the expectancy is only an approximation for a real trading system. In a real live real tradingsystem we may expect many possible outcomes for a trade, positively or negatively, and each outcome with a different probability p. Let outcome X¡ with ¡= 1, 2 , 3 ..k and probability p¡.
The expectancy of this real live tradingsytem becomes more complicated and becomes:
ΣP¡X¡ /ΣP¡(X¡)^2
See for a formalism this article about Money management.
Another point to be made here is that returns, the outcomes of a system may not be normally distributed but oblique towards (hopefully!) positive returns. This may especially being the case when using a fixed stop. Such a distribution may be more precisely described as a Weibull distribution, an interesting point but beyond the scope of this posting.
I currently look at my returns with respect to a Weibull distribution. One of the nice things of this kind of representation is that a Weibull distribution has a surprisingly relatively simple calculus involved.
Systemtrading
Expectancy
posted by Carlo Giuntoni at 6:09 PM
![]()
![]()


0 Comments:
Post a Comment
<< Home