Physical problems are sometimes modelled as random walks, sometimes also called a "drunkard's walk". In this model many successive steps are taken, but each in a random direction. The direction of each step being independant of the direction of the previous one.
A famous example is the Brownian motion of a smoke particle in very dilute gas. The invisible gasmolecules colliding at random against the, in comparison to the molecules, very big smoke particle. In two dimensions a random walk can be seen in the figure below.
 Random walk of 1000 steps
 Random walks have serious implications for probabilty events. When throwing a fair coin, you know the chance of a head equals the chance of a tail (50:50 or p= 1/2). But what are possible outcomes when throwing a fair coin? Suppose the coin did come with a streak of 6 tails in a row? What is the chance of the next throw also being a tail? The chance of another tail is just 1/2 independant of the foregoing outcome.
Many people intuitively assume that after a series of consequtive tails a head must show up with greater certainty. There are many examples of this assumption of what is called the expectation a
regression to the mean.
Last night I watched on television a pokergame (Texas Hold'em at the
Poker Den organised by
PartyPoker.com). There was this beautifull young lady getting bad cards al night and the commentators just outbursted that it is not possible to get bad cards forever, she had to get good cards at last: she played out without getting a picture and only a few hands played.
The man in the casino watching slot machines which didnot pay out for a long time is also an example of an expection for a regression to the mean. Casino's know this too well and just let the slot machines produce random numbers so the next outcome is independant of the previous one: a losing game by all means, the edge is to the house, the chance of a win is smaller than 1/2.
But let's return to a coin. I found an astonishing picture in
A Guide To Gambling, Love, The Stock Market & And About Everything Else, a book I
noted before.
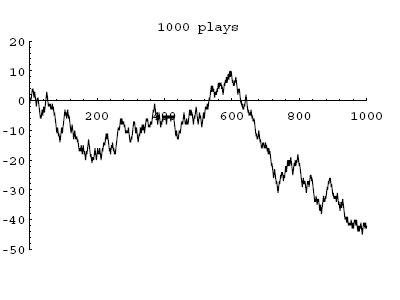
The graph shows the result of a computer-simulated sequence of thousend thosses of a fair coin, eacch time a head is coming up it adds up +1 and when a tail comes up-1. You feel since the probability of each result, tail or head, is equal, here should be as may heads as tails after a certain time.
Now this is true but only after
a very long time, in fact after
infinite time. Over the short term, which may relatively long periods, more heads than tails occur and vice versa. This supposes very long lasted unexpected streaks of either tails or heads. This is the random walk of a coin.
There is a formula for the probability of a streak:
- q = [1+(n-r) p]q' (1)
- n = amount of tosses (trades!)
- r = losing streak
- p = chance of a single outcome
- q' = P^r (power r)
For an explanation and an example see
winning and losing streaks. We return to our activities on the stockmarket. Market prices are sometimes also considered as random walks (especially as the outcome a of classical price theories). In a way we could see in graph above the movement of a stock price (or future or whatever) in time.
In an earlier posting I gave a
distribution of one day and 5 days returns on the GBP/USD. Clearly these distributions are not random: it resembles more of a normal distribution around a mean. Whatever it is, the movements in a much smaller timeframe, eg ticks, could still be a random walk. Maybe the duration in which the one day and 5 day returns are gathered is just to small to reject a random walk.
In approximation the distance R² from a starting point in a random walk to the end point is proportional to N in which N is total of steps:
R² = N*r (2)
r is the square root of the average squared step size or root mean squared step size. If I take
r as a tick on the FDAX and normalise to 1 formula (2)becomes:
R² = N.and R is epresssed in ticks.
(followed)
Systemtrading
gambling and trading