CONSEQUTIVE LOSSES
In two lucid and interesting articles in Traders of January two subjects were discussed, subjects I studied extensively. Luca Barberis tried to give an answer to the question how trading of various markets can enhance the equity curve without optimising individual trading systems. Optimising hides the danger of curve fitting. Though his results are very important a few aspects remains to be answered before applying his method: how many contracts do you trade the various markets, which is not a matter of classical position sizing matters and the question of a possible trade system correlation and what effect this has on risk.
Risk is the main subject of Philip Kahler in Traders. He treats various possible types of risk in trading, especially risk due to consecutive losses and emphasizes its importance to understand how consecutive losses can influence trading results. When studying consecutive losses in series of trades a huge field opens up: many different theoretical frameworks can be set up to master this phenomenon of trading.
There is a clear relation between the win ratio of a trade system and the length of consecutive losses. In an earlier post I stressed the importance of the win ratio in a different context. But it also plays an important role in the existence, the length, and the amount of consecutive losses.
In general can be said that the higher the win ratio the higher the chance becomes for a series of losses of a certain length. In his article Kahler gives some examples and a graphic which can be used to determine 5 or 10 consecutive losses for a given win ratio. It has to be said that these probabilities occur for a given amount of trades performed and will change negatively when the total trades increases.
Though interesting to know the chance for a series of losses it would be even more interesting to know a distribution of series of losses, e.g. the probability for all possible series of losses and moreover the maximum length of consecutive losses (maximum streak) you might expect for a given win ratio.
Below you can see a figure which gives the relation for the maximum streak and the probability of a loss (loss ratio). Total trades is 500, confidence is 0.998%.
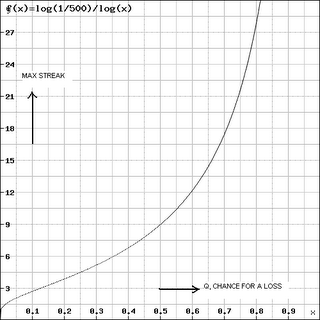
From this figure again can be seen the importance of the loss ratio: the higher this becomes (the more losses)then the maximum strak increases exponentially. E.g when q, the probability of a loss is 35% then the maximum expected streak willl be 6 but when increasing to 70% the maximum streak increases to 17 consequtive losses in a row!
posted by Carlo Giuntoni at 9:11 PM
![]()
![]()


0 Comments:
Post a Comment
<< Home